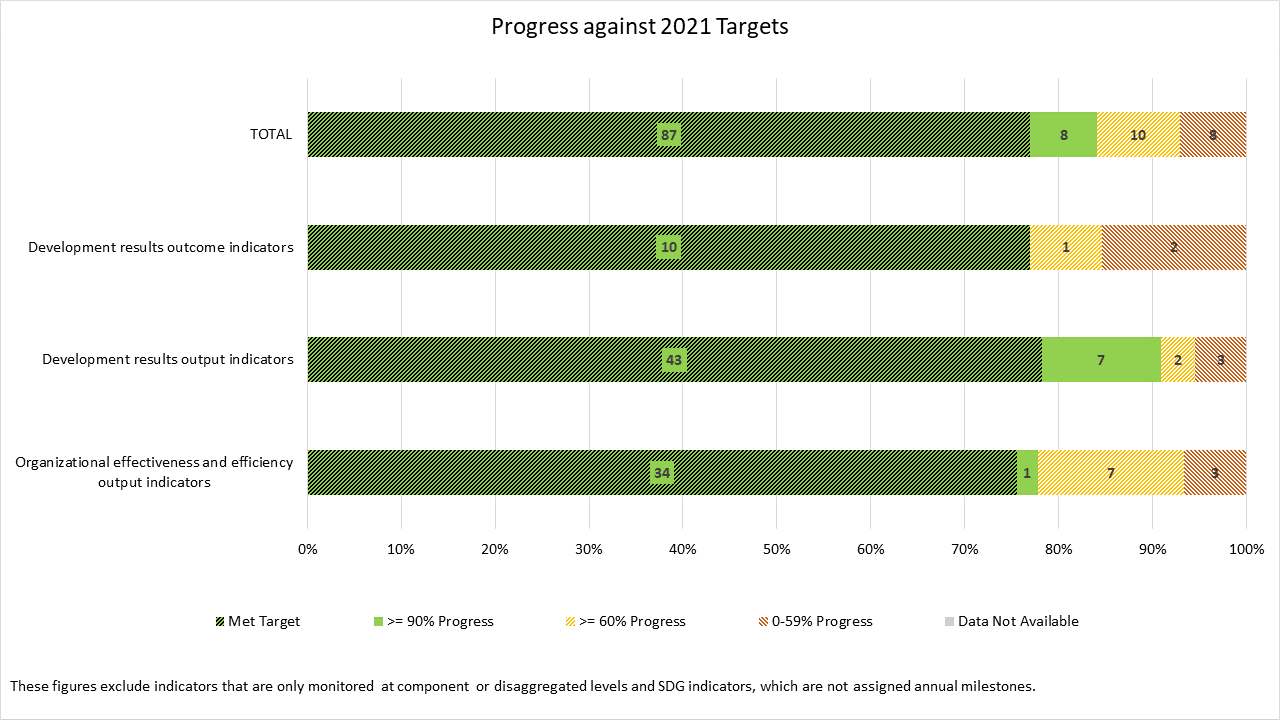
PROGRESS UNDER 2021 TARGETS This chart provides an overview of progress under 2021 targets set in the IRRF of the Strategic Plan 2018-2021. 77 percent of targets set at the outcome level were met. Good performance (within 10 percent of the targets) was achieved for 91 percent of indicators at the development results output level (78 percent of the targets were met). This chart presents the data as of March 2022.
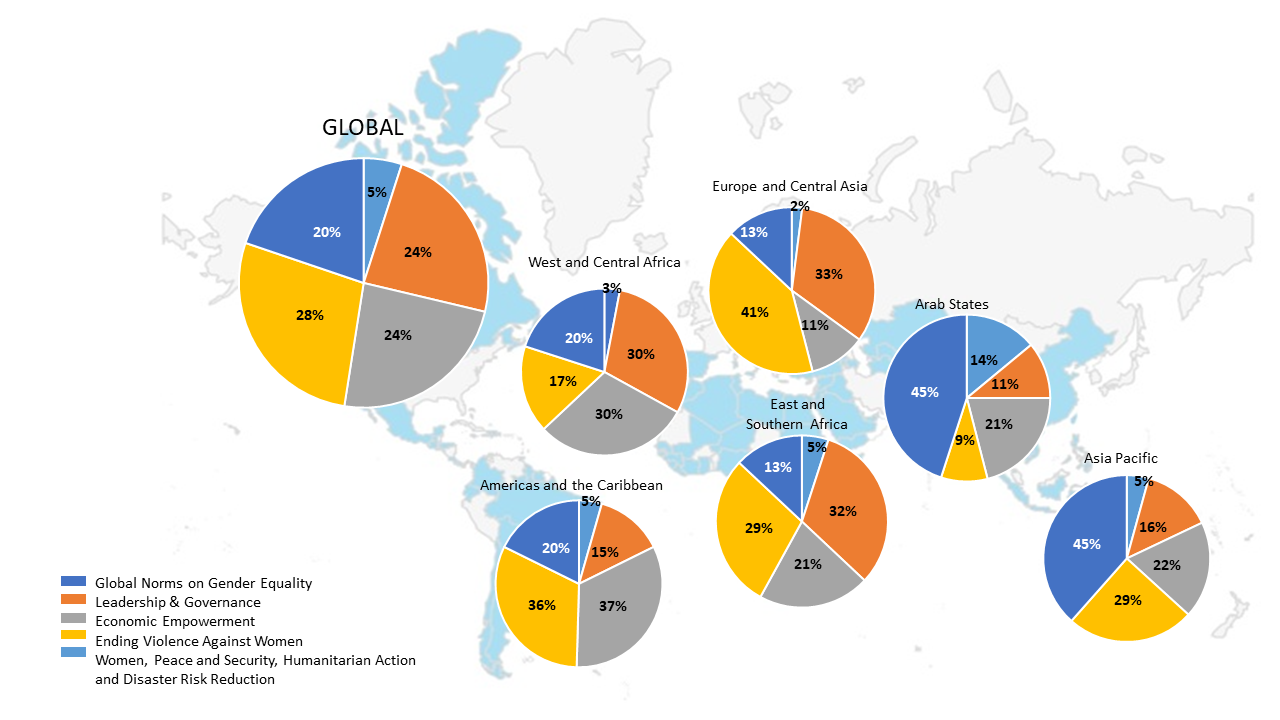
Global and regional distribution by output level results in each of the impact areas These charts help understand the thematic focus in UN-Women programmes in each region, as well as globally, in 2021. For example, Europe and Central Asia had the greatest focus on Ending Violence Against Women in terms of percentage of outputs (41% of all outputs in the region).
LEAVING NO-ONE BEHIND The principle of leaving no one behind is reflected as a guiding principle in UN-Women’s Strategic Plan 2018-2021. A number of indicators in the Development Results section of the Strategic Plan’s IRRF use disaggregation by basic demographic characteristics, such as age, sex, and geographical location, as part of the Entity’s explicit planning and reporting on efforts to leave no one behind. The table below highlights output indicators’ results for 2021 and their distribution across these characteristics.
|
Development Results |
|||||||
|
Output indicators with available disaggregated data, 2021 reporting |
|||||||
|
Indicators with data available by sex |
|||||||
|
Output Indicator |
Female |
Male |
Unspecified |
Total |
|||
|
2.4.2 Number of women leaders, candidates and aspirants with strengthened capacities to engage in political life, with UN-Women’s support* |
11,579 |
|
|
11,579 |
|||
|
2.7.1 Number of personnel of formal and informal justice institutions whose capacities to provide justice to women are strengthened, with UN-Women’s support* |
18,046 |
19,592 |
30,843 |
68,481 |
|||
|
2.7.3 Number of women accessing legal aid with UN-Women’s support |
46,708 |
|
|
46,708 |
|||
|
3.9.1 Number of women with strengthened capacities and skills to participate in the economy, including as entrepreneurs, with UN-Women’s support* |
185,215 |
|
|
185,215 |
|||
|
3.9.2 Number of women entrepreneurs supported to access finance and gender-responsive financial products and services, with UN-Women’s support* |
61,397 |
|
|
61,397 |
|||
|
3.10.2 Number of rural women supported to gain access, use and/or control of productive resources by UN-Women* |
62,108 |
|
|
62,108 |
|||
|
4.12.4 Number of partners supported by UN-Women whose knowledge and skills to influence legislation and policies on sexual violence against women and girls in public spaces are improved |
622 |
395 |
1,294 |
2,311 |
|||
|
5.14.3 Number of women and girls directly accessing UN-Women supported humanitarian services |
562,397 |
|
|
562,397 |
|||
|
Indicators with data available by age |
|||||||
|
Output Indicator |
UP TO 9 |
AGE 10-17 |
AGE 18-30 |
31-60 |
61+ |
Unspecified |
Total |
|
2.4.2* |
|
|
9,546 |
7,240 |
235 |
- |
11,579 |
|
3.9.1* |
|
150 |
571 |
926 |
28 |
183,540 |
185,215 |
|
3.9.2* |
|
150 |
255 |
563 |
30 |
60,399 |
61,397 |
|
3.10.2* |
|
76 |
17,438 |
8,734 |
971 |
34,889 |
62,108 |
|
5.14.3 |
546 |
142,165 |
295,182 |
6,800 |
117,704 |
562,397 |
|
|
Indicators with data available by geographic location |
|||||||
|
|
Rural |
Urban |
Urban slum areas |
Unspecified |
|
||
|
3.9.1* |
45,168 |
114,013 |
13 |
26,021 |
185,215 |
||
|
3.9.2* |
16,865 |
431 |
- |
44,101 |
61,397 |
||
|
*Although these indicators have a cumulative methodology, numbers here refer to 2021 results only, since 2018 results were used as a pilot phase. Please see the indicator flip-cards on other pages of this portal for more information on these indicators |
|||||||
Other indicators in UN-Women's Strategic Plan measure results towards leaving no one behind, for example, by focusing on maximizing the number of direct beneficiaries in rural areas (e.g. indicator 3.10.2: Number of rural women supported to gain access, use and/or control of productive resources by UN-Women). In the 2021 Report of UN-Women's Executive Director on the implementation of the Strategic Plan 2018-2021, UN-Women also reported quantitative results by other characteristics such as disability status, where relevant; and qualitative results from UN-Women's field offices' work to leave no one behind. In addition, further information was presented in its 2021 Annex VI. Report on the implementation of the quadrennial comprehensive policy review of operational activities for development of the United Nations system.
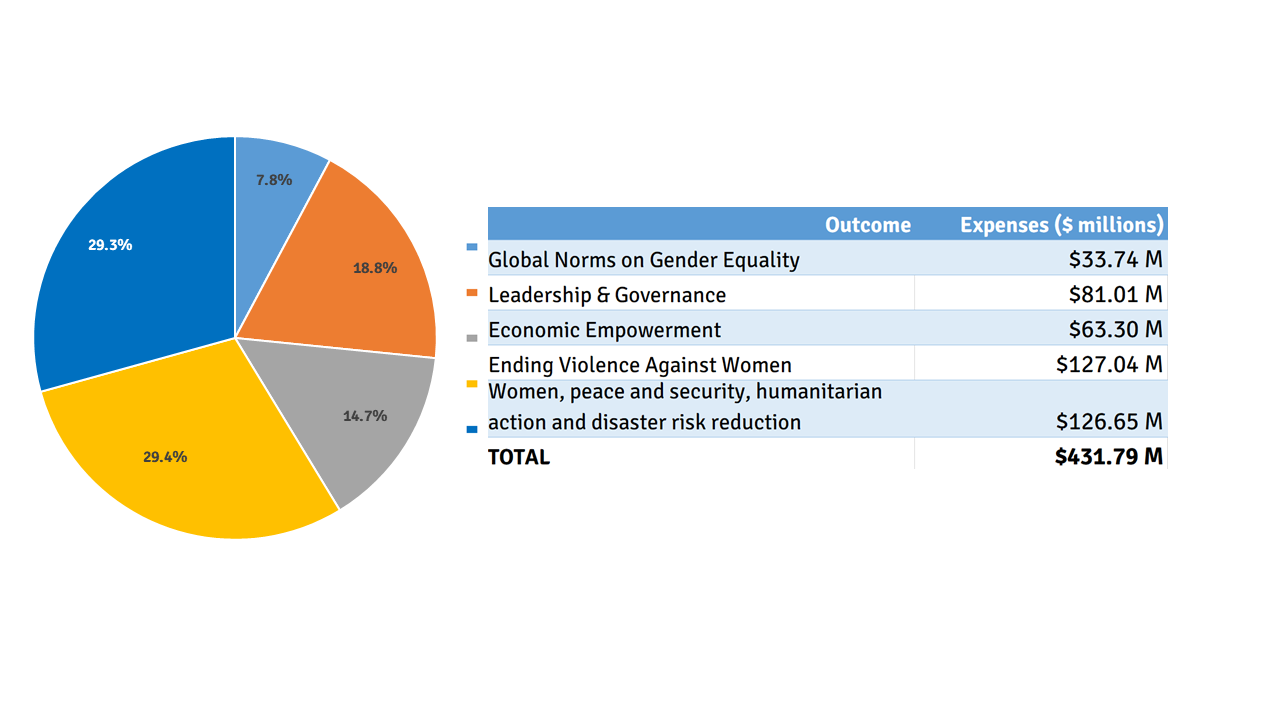
Programme Expenses by Outcome Area This chart shows the overall distribution of UN-Women programme expenses ($ millions) by outcome in 2021. Total UN-Women programme expenses for 2021 was $431.8 million. Financial information for the period ending 31 December 2021 has been prepared on an accrual accounting basis in accordance with International Public Sector Accounting Standards (IPSAS).
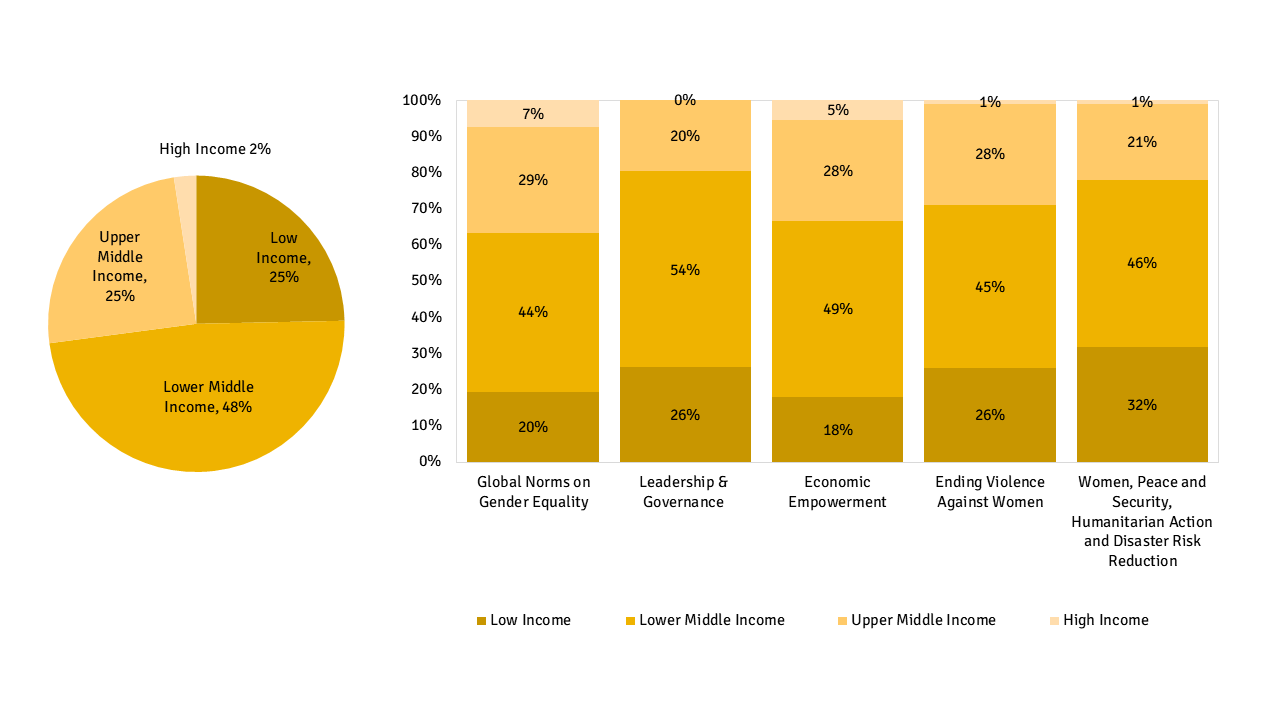
Distribution of outcomes by income groupings The pie chart provides the 2021 percentage distribution of outcomes by country typology: low income, lower middle income, upper middle income and high income countries/territories. The column chart illustrates the percentage distribution of outcomes by country typology within each outcome. For example, 49 per cent of all outcomes that address Economic Empowerment are supported by UN-Women in Lower Middle Income Countries. (Source for country classification: The World Bank https://datahelpdesk.worldbank.org/knowledgebase/articles/906519-world-bank-country-and-lending-groups)